NetworkX only provides basic functionality for visualizing graphs. It looks ugly to draw trees with its built-in graph layout. This article presents how to draw beautiful trees with pygraphviz and convert the format between NetworkX and Graphviz (dot).
1. Install PyGraphviz
To install pygraphviz on macOS,
$ brew install graphviz
$ sudo pip install pygraphviz
2. Draw trees with PyGraphviz
We use node positioning algorithms provided by Graphviz for tree drawing. Graphviz is a package for drawing graphs specified in DOT language scripts. It also provides a set of tools that can generate and/or process DOT files. PyGraphviz is a Python interface to Graphviz for accessing the Graphviz graph data structure and layout algorithms.
graphviz_layout is a wrapper for pygraphviz_layout that creates node positions for a graph using Graphviz. Note that in new versions of NetworkX, graphviz_layout is moved to nx.drawing.nx_agraph. Import it explicitly by,
from networkx.drawing.nx_agraph import graphviz_layout

pos = graphviz_layout(G, prog='dot')

# Interfaces
graphviz_layout(G[, prog, root, args])      # Create node positions for G using Graphviz.
pygraphviz_layout(G[, prog, root, args])    # Create node positions for G using Graphviz.
Here is an example. The source code is hosted on my GitHub, here.
import networkx as nx
import matplotlib.pyplot as plt
from networkx.drawing.nx_agraph import graphviz_layout

def main():
    # Create a directed graph
    G = nx.DiGraph()

    # An example
    l=[ ('a','b'),
        ('b','c'),
        ('c','d'),
        ('d','e'),
        ('e','f'),
        ('w','x'),
        ('w','t'),
        ('t','q'),
        ('q','r'),
        ('q','u')]

    # Build up a graph
    for t in l:
        G.add_edge(t[0], t[1])

    # Plot trees
    pos=graphviz_layout(G, prog='dot')
    nx.draw(G, pos, with_labels=True, arrows=False)

    plt.savefig('draw_trees_with_pygraphviz.png', bbox_inches='tight')
    plt.show()

if __name__ == '__main__':
    main()
which produces,
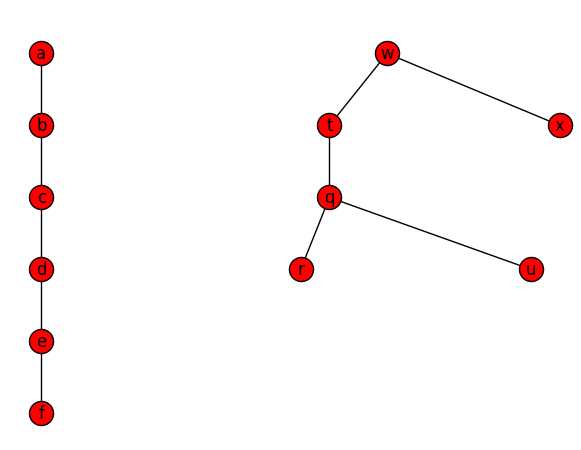
Fig. 1: A tree drawn with NetworkX and PyGraphviz
3. Format conversion between Networkx and Graphviz AGraph (dot)
NetworkX provides interfaces to convert the format between NetworkX and Graphviz AGraph (dot).
from_agraph(A[, create_using])      # Return a NetworkX Graph or DiGraph from a PyGraphviz graph.
to_agraph(N)                        # Return a pygraphviz graph from a NetworkX graph N.

write_dot(G, path)                  # Write NetworkX graph G to Graphviz dot format on path.
read_dot(path)                      # Return a NetworkX graph from a dot file on path.
The following snippet code shows how to convert the format between them.
import networkx as nx

G = nx.complete_graph(5)        # <networkx.classes.graph.Graph object at 0x1057c5850>

# nx --> dot
A = nx.nx_agraph.to_agraph(G)   # <AGraph complete_graph(5) <Swig Object of type 'Agraph_t *' at 0x1032eb8a0>>
# dot --> nx
H = nx.nx_agraph.from_agraph(A) # <networkx.classes.graph.Graph object at 0x1057c5310>
After a graph is converted into the format dot, we can process graphs using PyGraphviz. Refer to PyGraphviz: AGraph Class for the detailed operations.
References:
[1] PyGraphviz